Sprint mapping story
Place Du Portage
Multi-level Sprinting
Earlier in November I organized a complex sprint training session for my home club, Orienteering Ottawa, on a new map I had just completed. The area is a neat multi-level urban area with some extremely busy multi-lane roads that were marked out of bounds. Figuring out how to cross from one level to the other and get to the other side of the road was the main head-scratching puzzle. This article has two parts. Part 1 is an opportunity for you to study the map and see if you can figure out the various routes for each leg. Part 2 is the story of how this map came to be.
Part 1 - Exploring the course
I encourage you to look at the entire course and see if you can figure out the complicated legs (up until 14 and then leg 26). The following information might help.
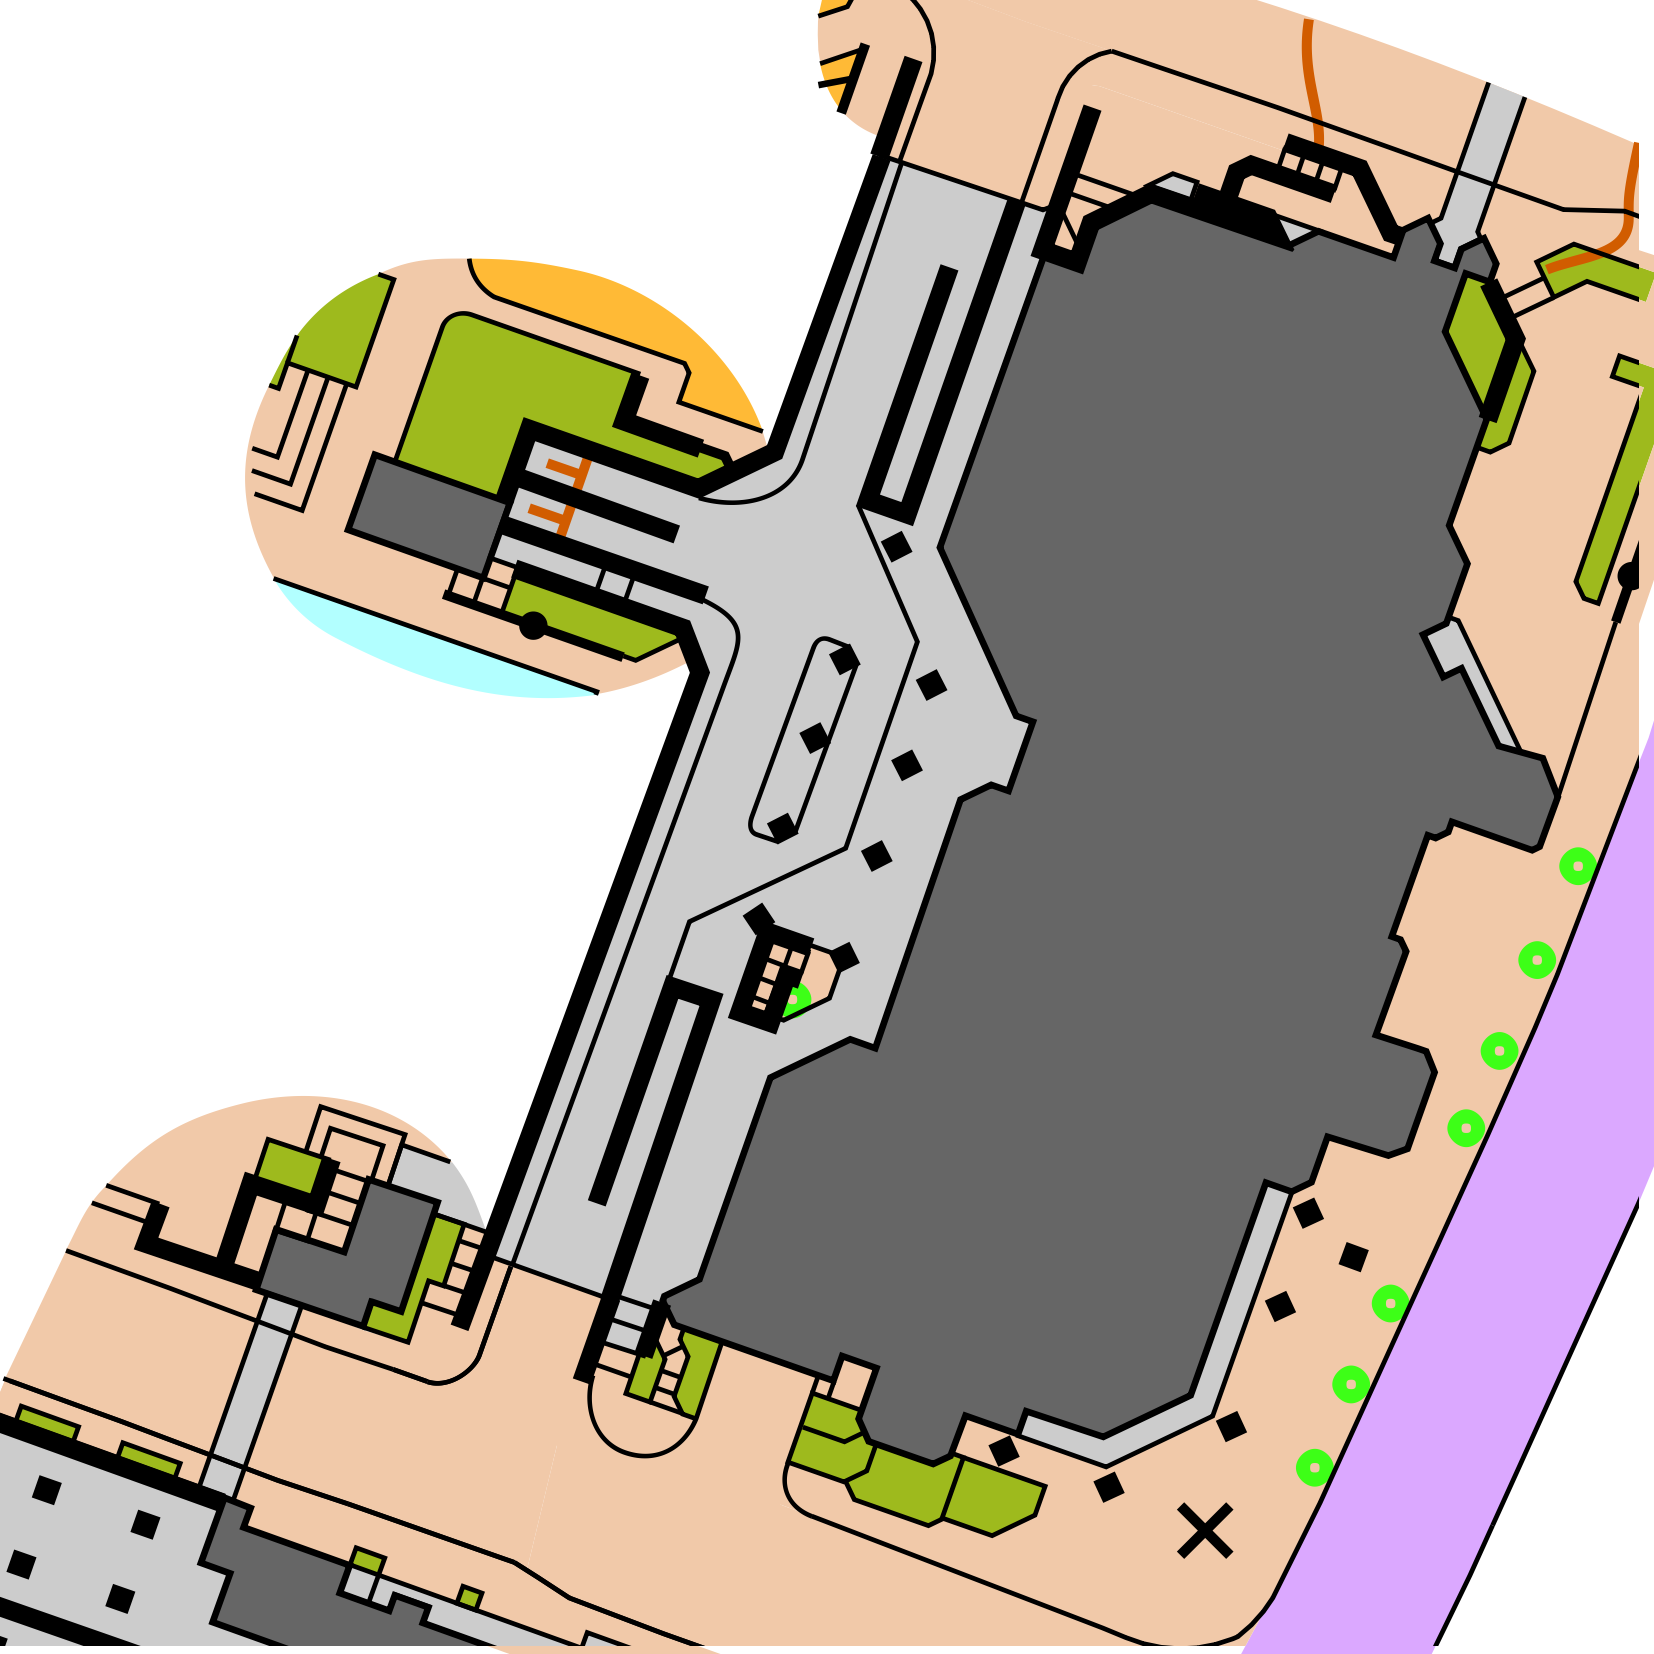
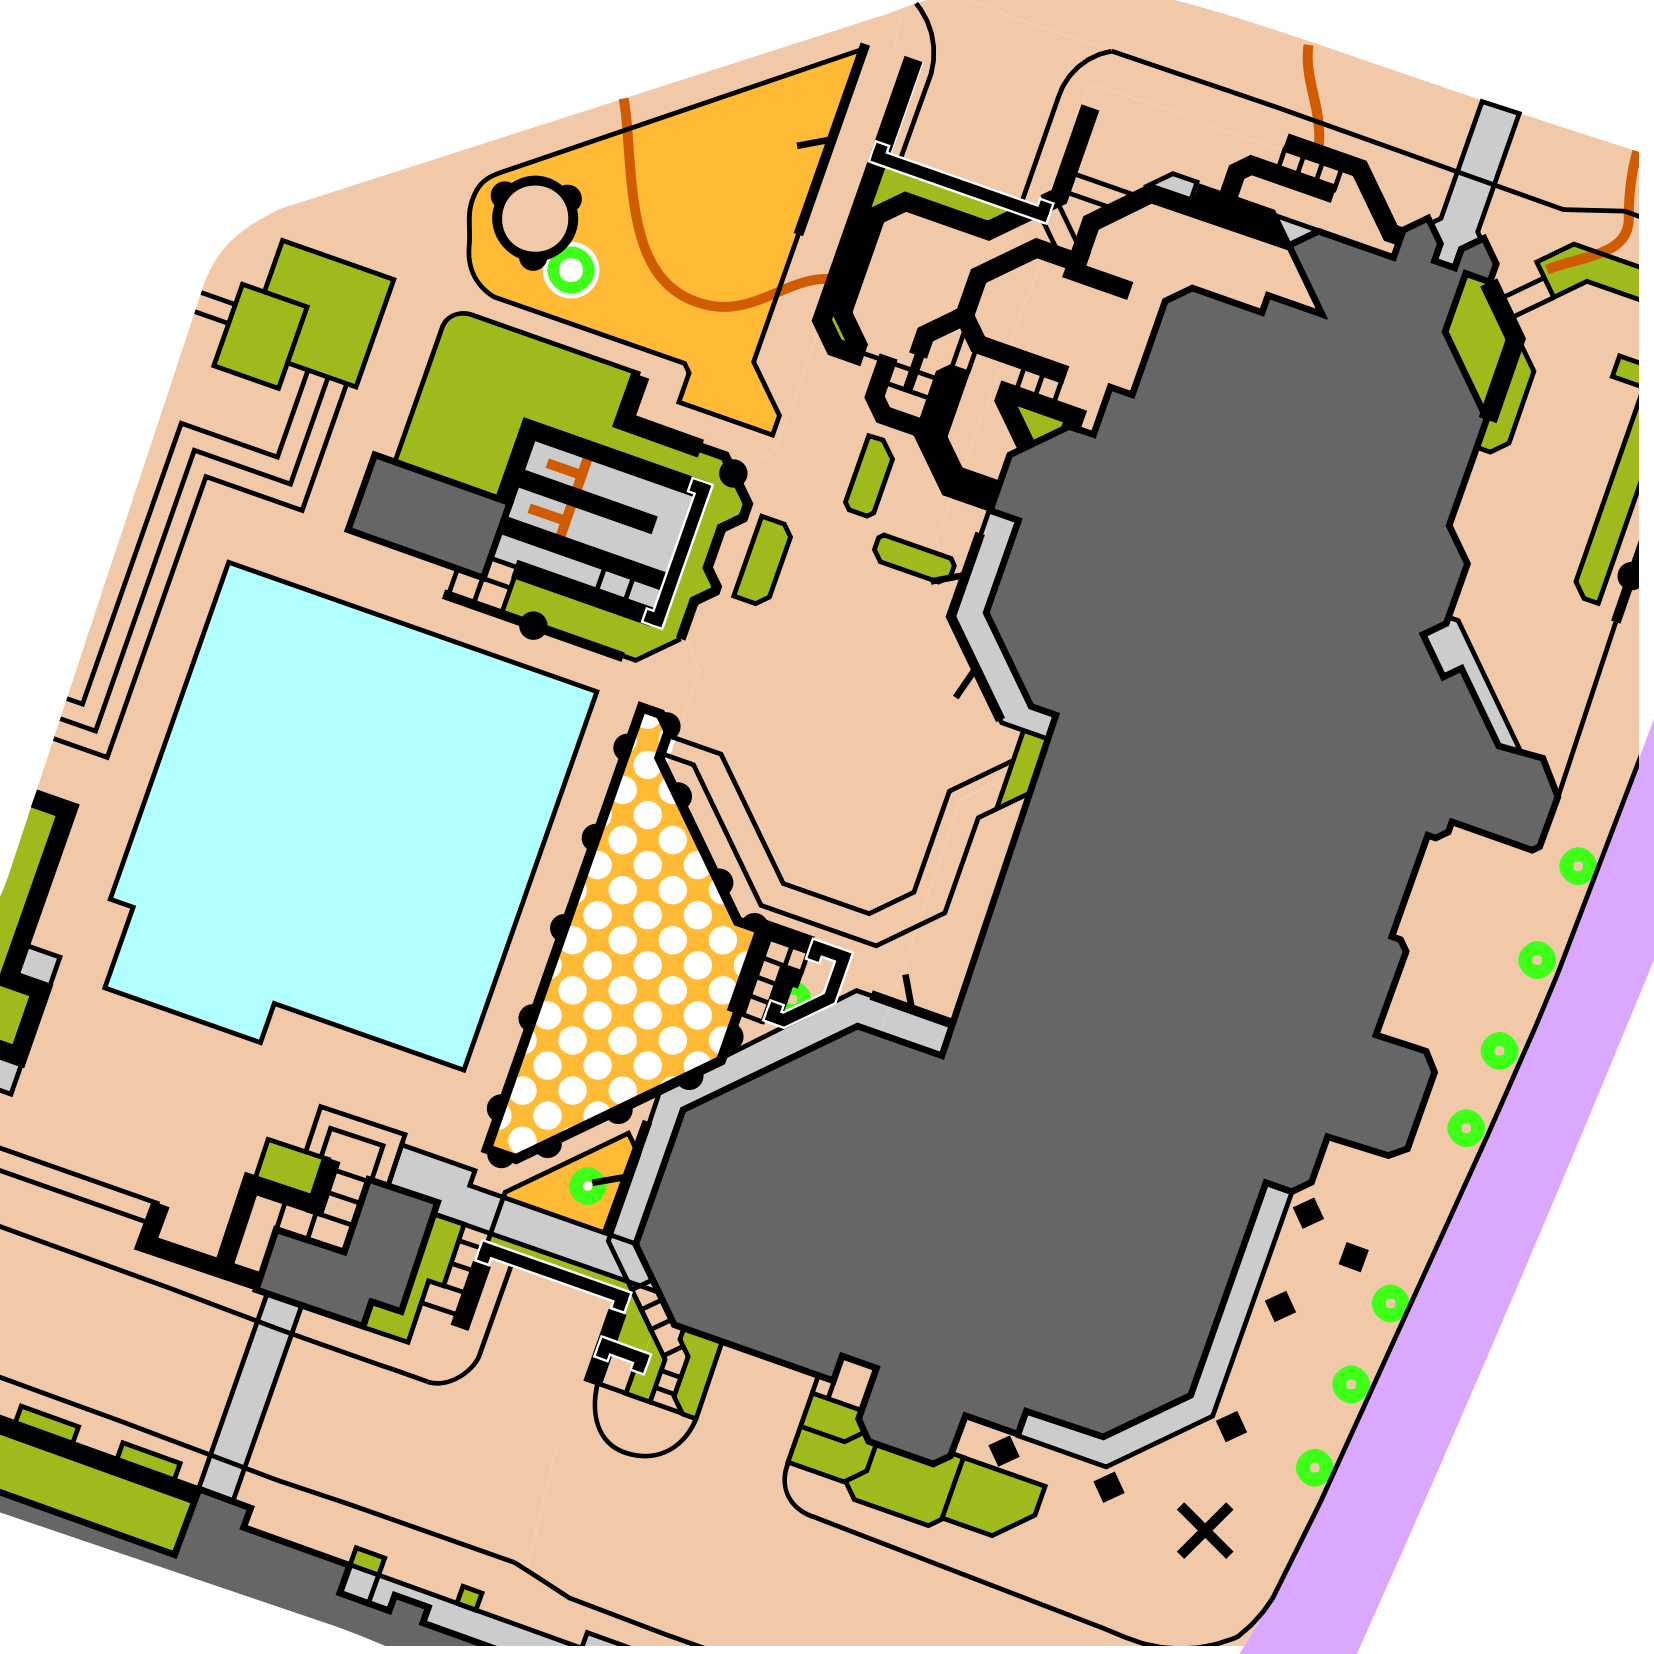
- The first page of the map has used multilevel mapping symbols as per the newish ISSprOM. The second page of the map has maps of just the upper layer and the lower layer which are helpful in showing those levels more clearly.
-
Control circles have been coloured to help indicate which level the control is on:
- Pink circles are on the lower level
- Blue circles are on the upper level
- Standard purple circles are in an area where there is only one level
- You can’t cross the main road ‘Blvd de la Maisonneuve’ at street level but you can run up and down the sidewalk on both sides.
-
Take the time to figure out where you can cross from one level to the other:
- o There is a hard to find staircase between controls 9 and 10 that goes between levels (it’s extra complicated there – I couldn’t come up with a good way to map it ?).
-
A quick explanation of the multi-level mapping:
- Simple canopies are shown in the standard grey canopy symbol. This symbol is also used very heavily in the lower level map
-
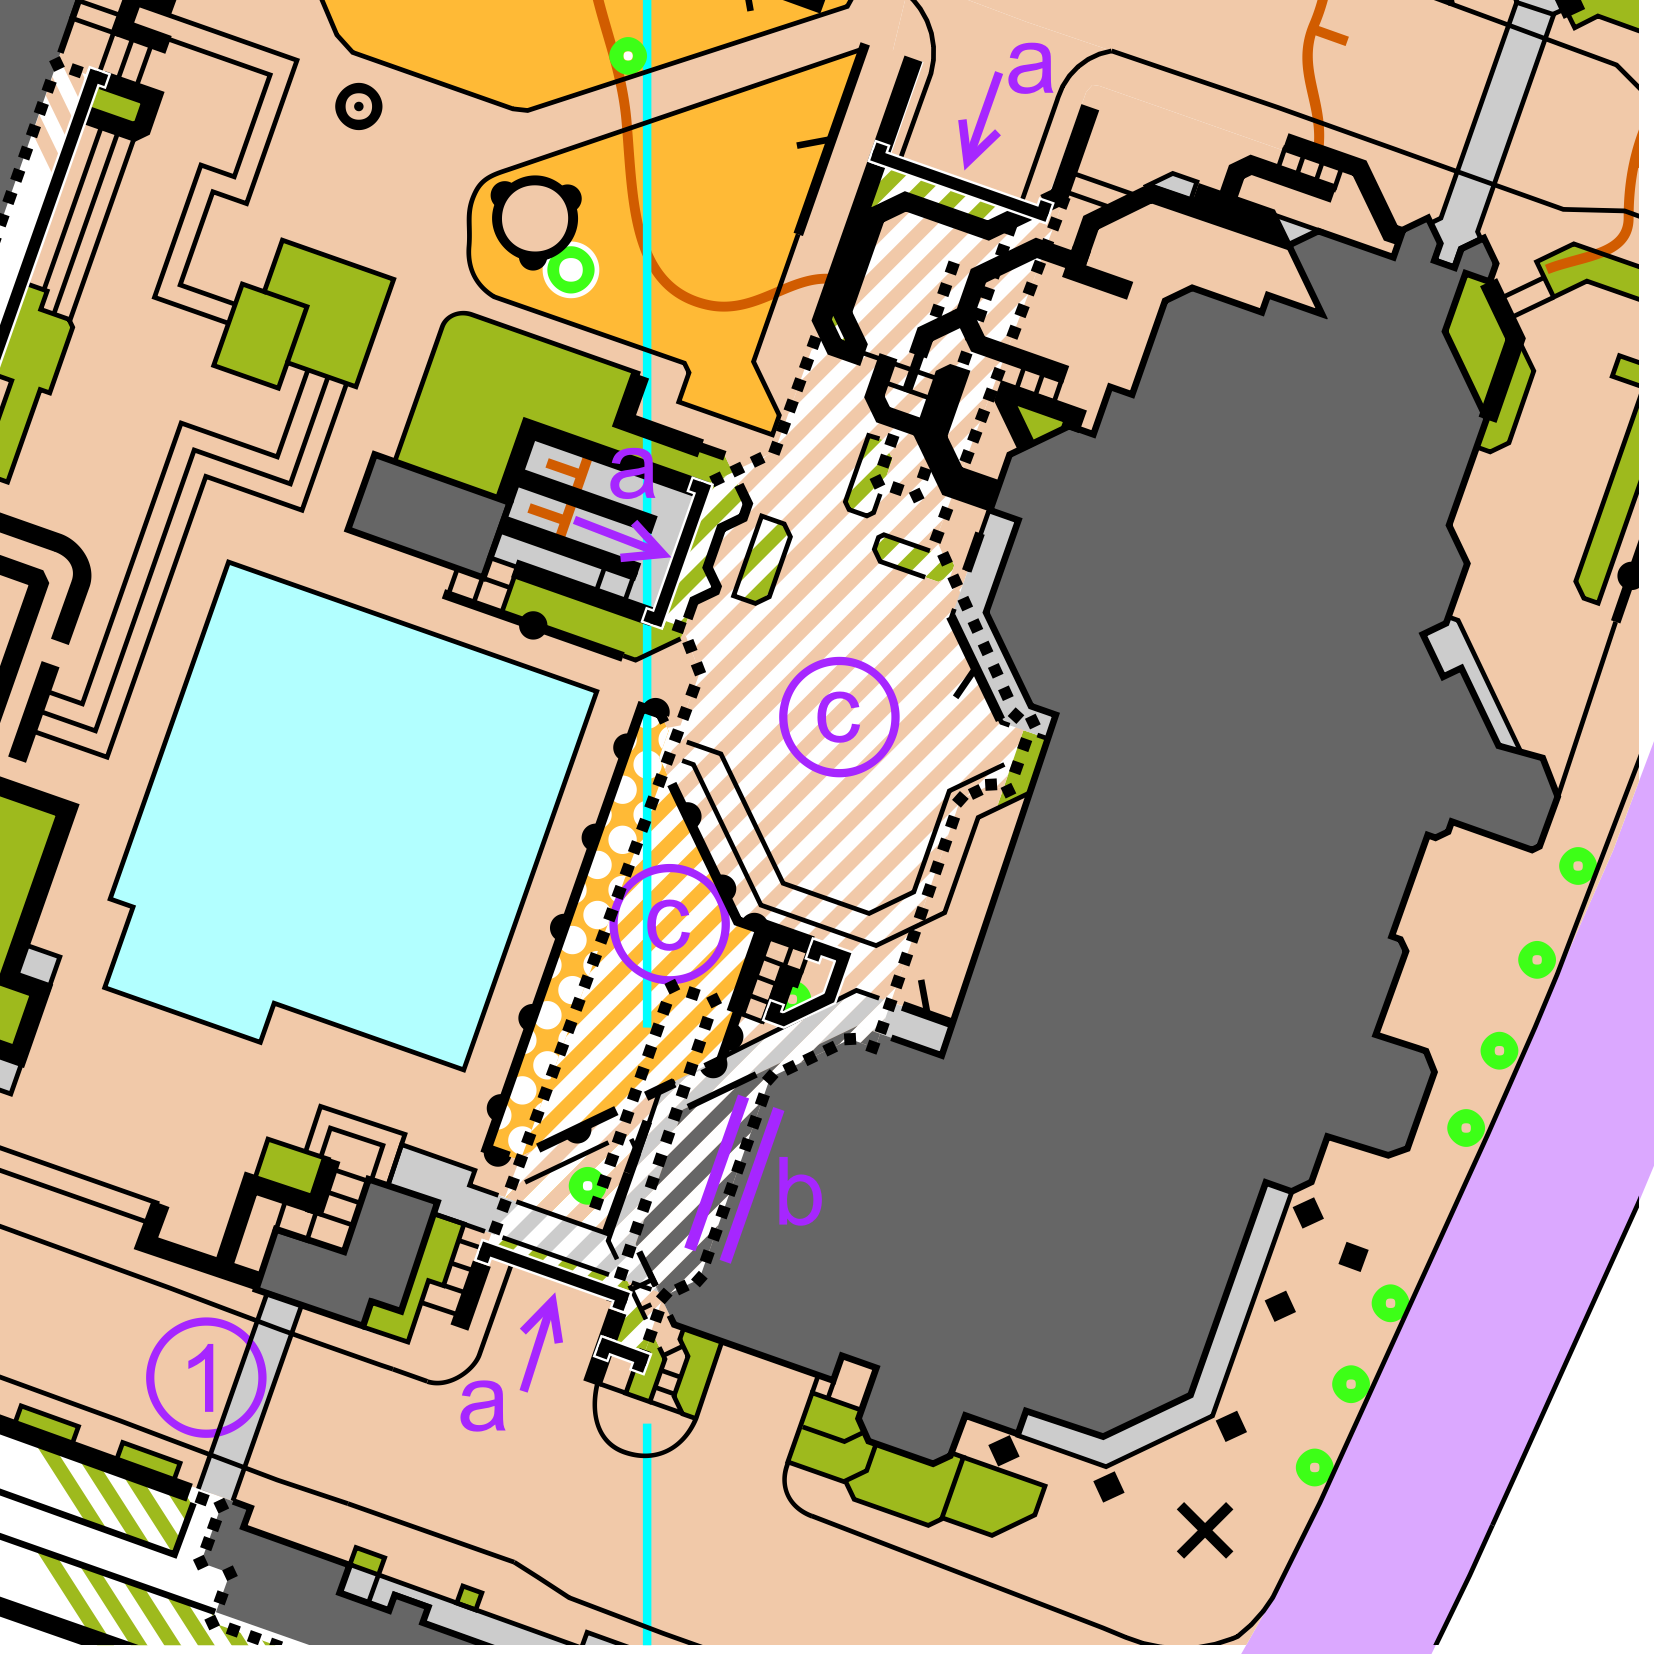
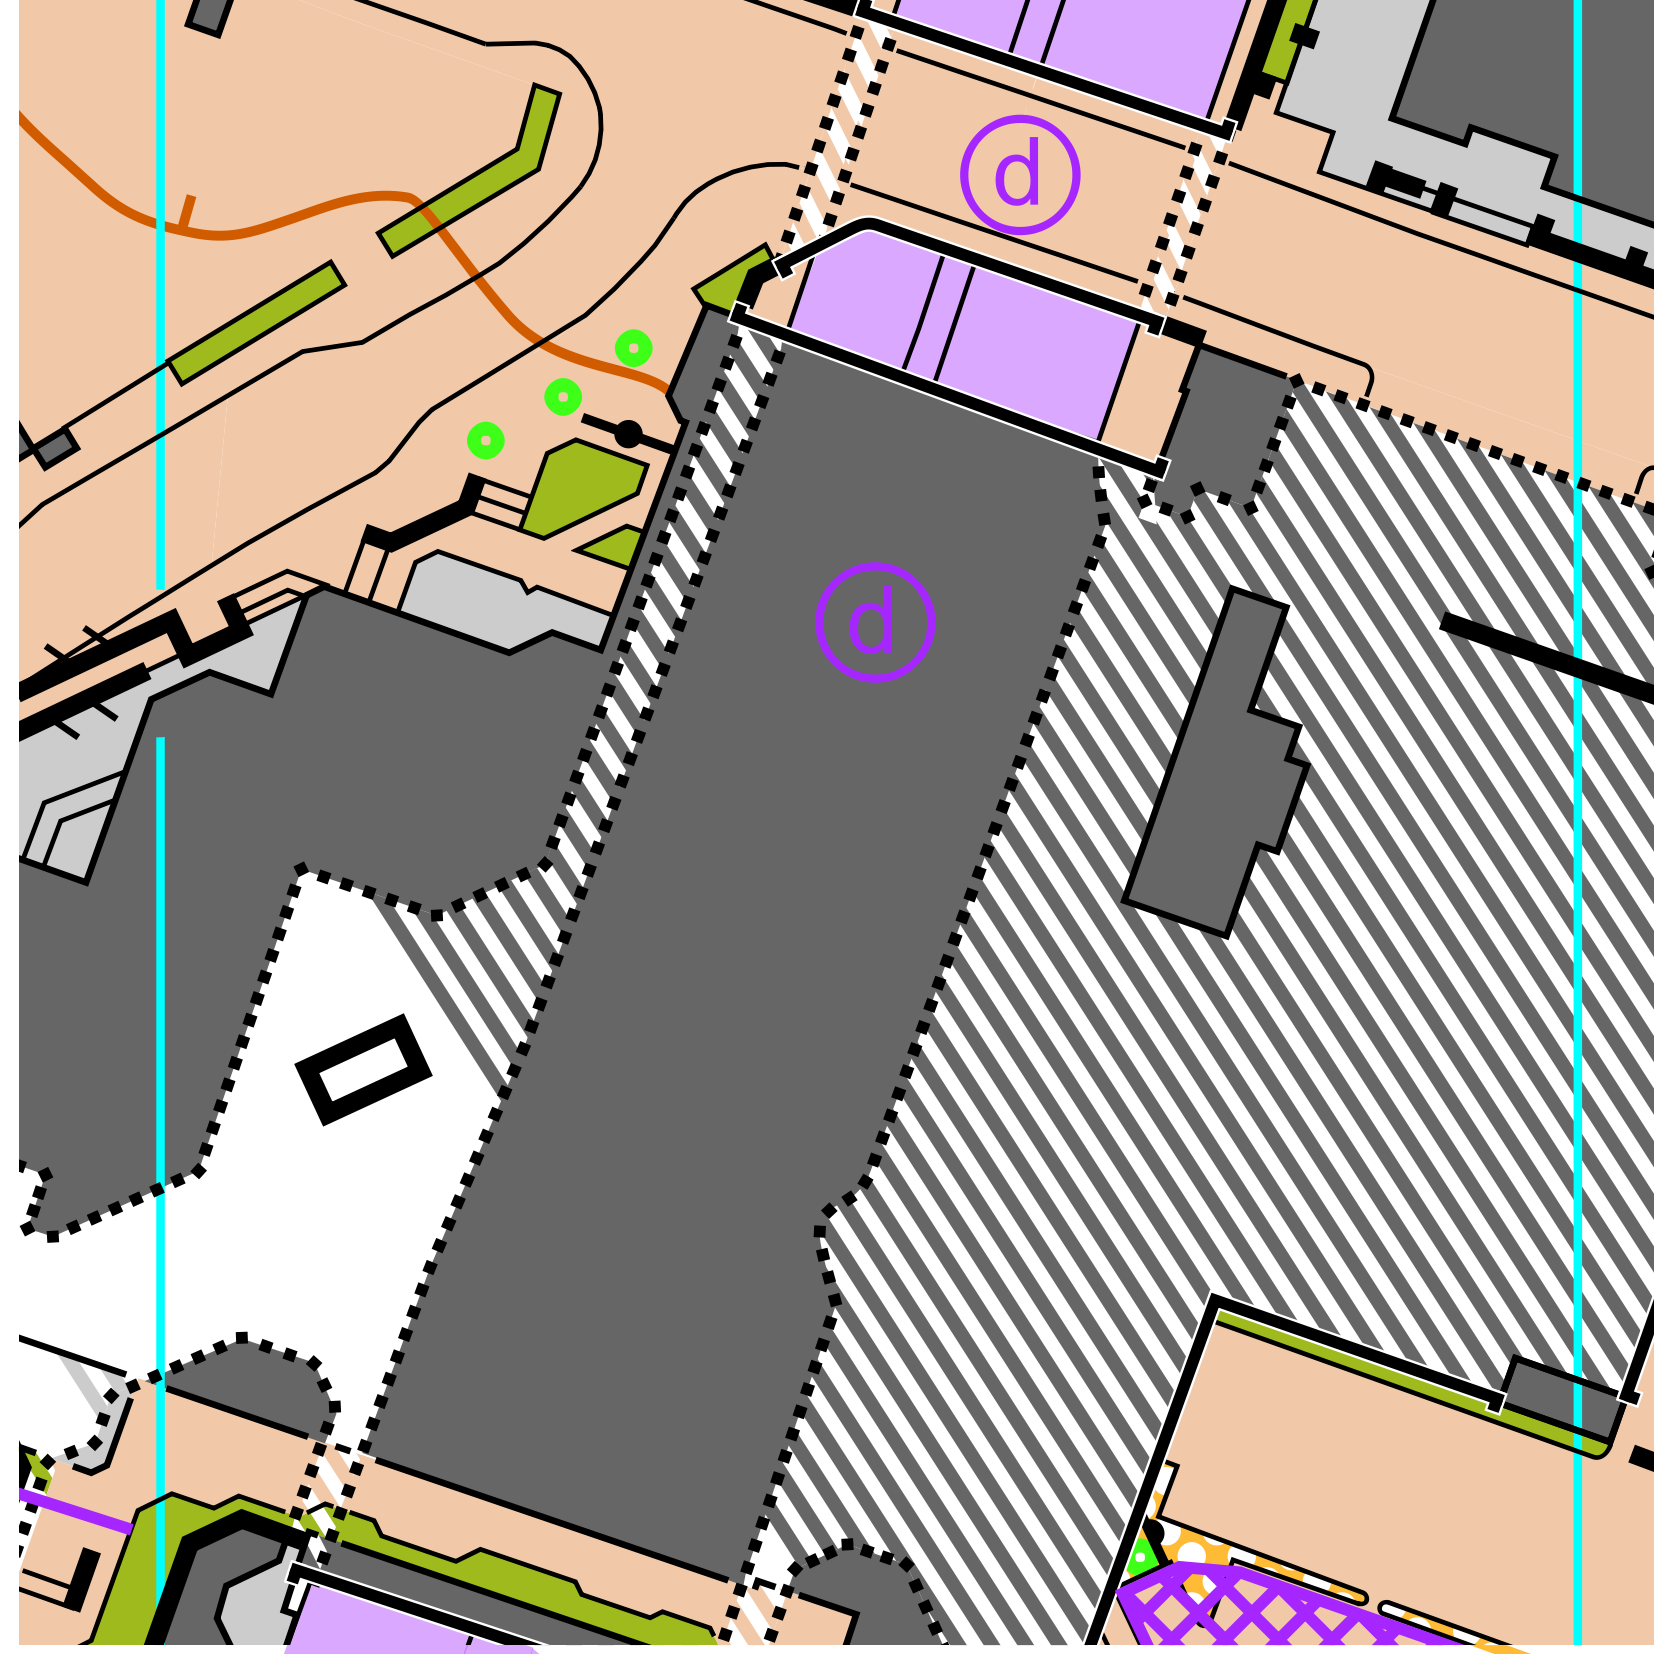
Areas where you can run on the upper and lower levels, or where using the grey canopy would result in a disjoint in the map, have instead been mapped with striped colour and bridge and tunnel symbols (see labelled images below):
- Areas where you can access the lower level are shown with the ‘bridge’ symbol.
- Key walls in the lower level including the main walls of the tunnel have been shown with a square dotted line. In cases where the wall cannot be confused as being on the upper level a solid wall symbol has been used.
- The colour of the striped area represents the upper running surface. You can run under but not on olive green and dark grey (building) stripes.
- Where the lower level is out of bounds the upper level has been shown in solid colours to indicate you are not allowed to run underneath it.
How did you fare?
Here are some of the ‘answers’ to some of the more interested/complicated legs:
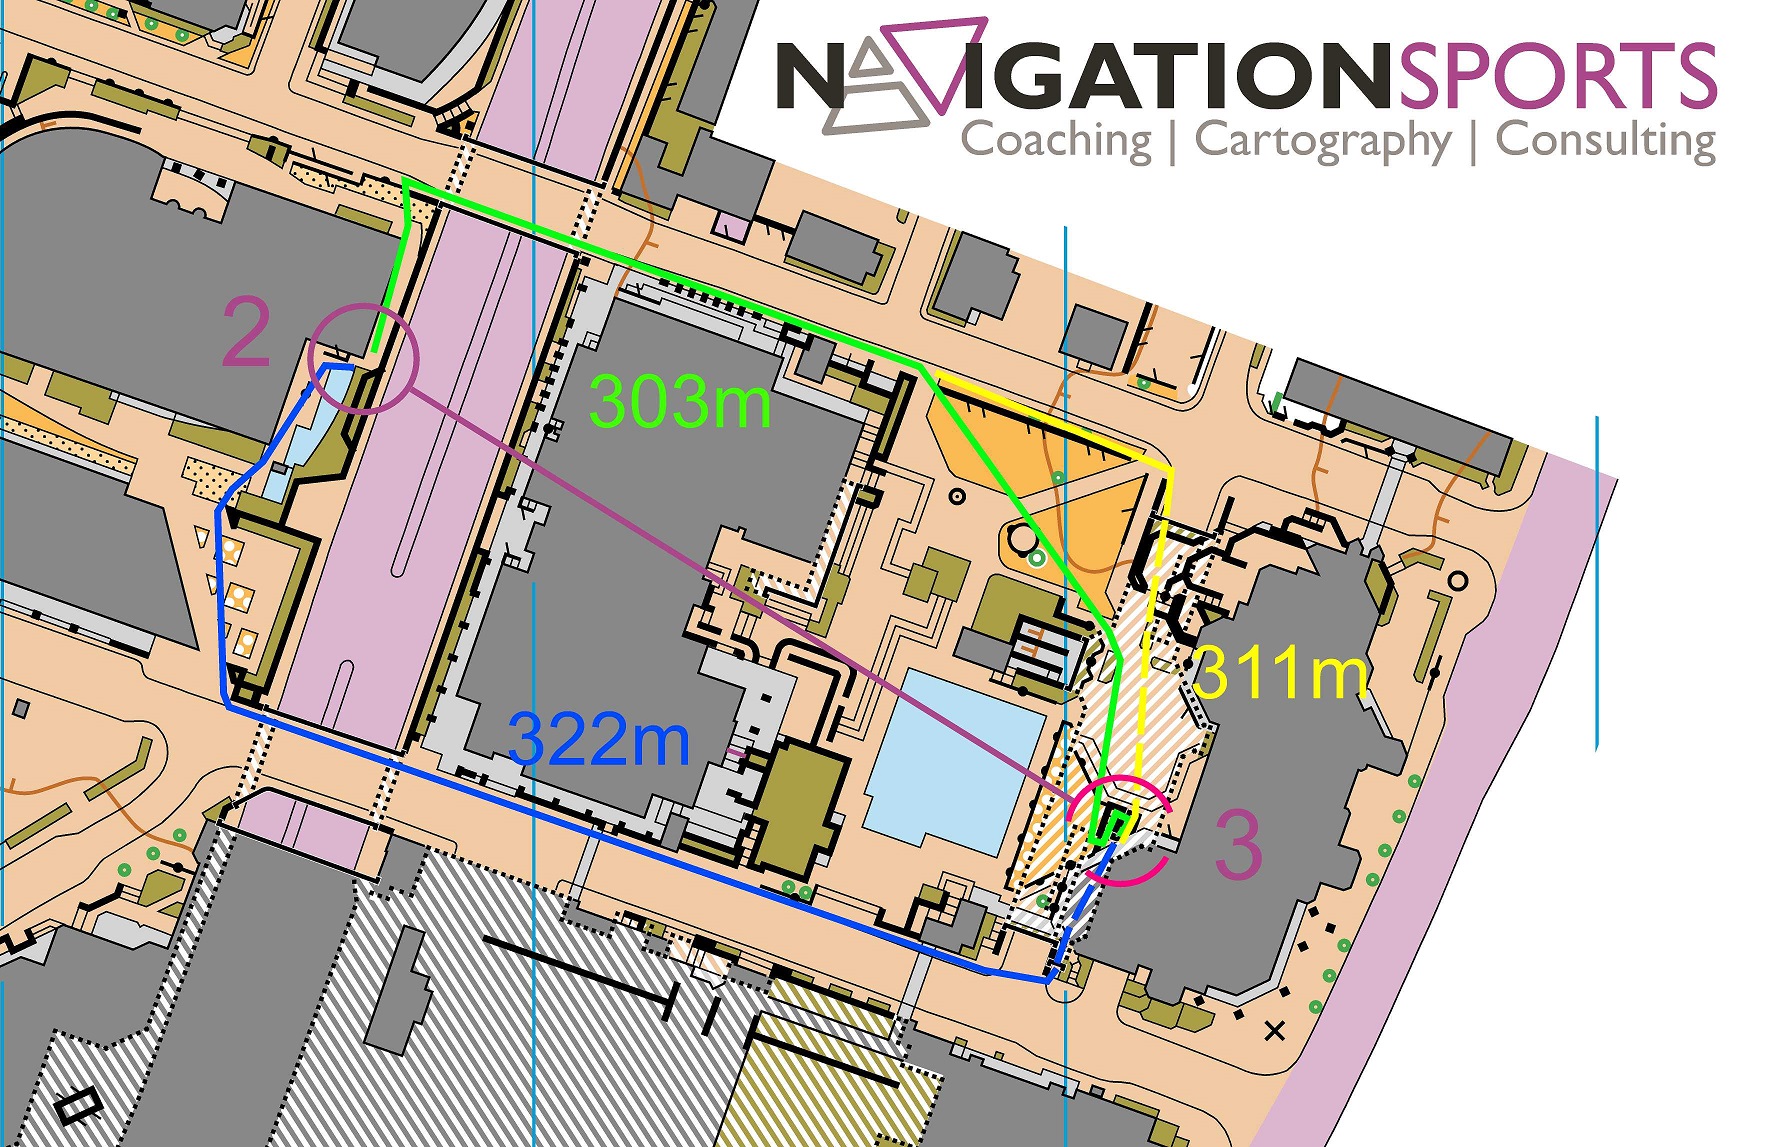
Leg 3 - The green route is the shortest (and best) route. You stay on the upper level and then climb down the stairs at the very bottom.
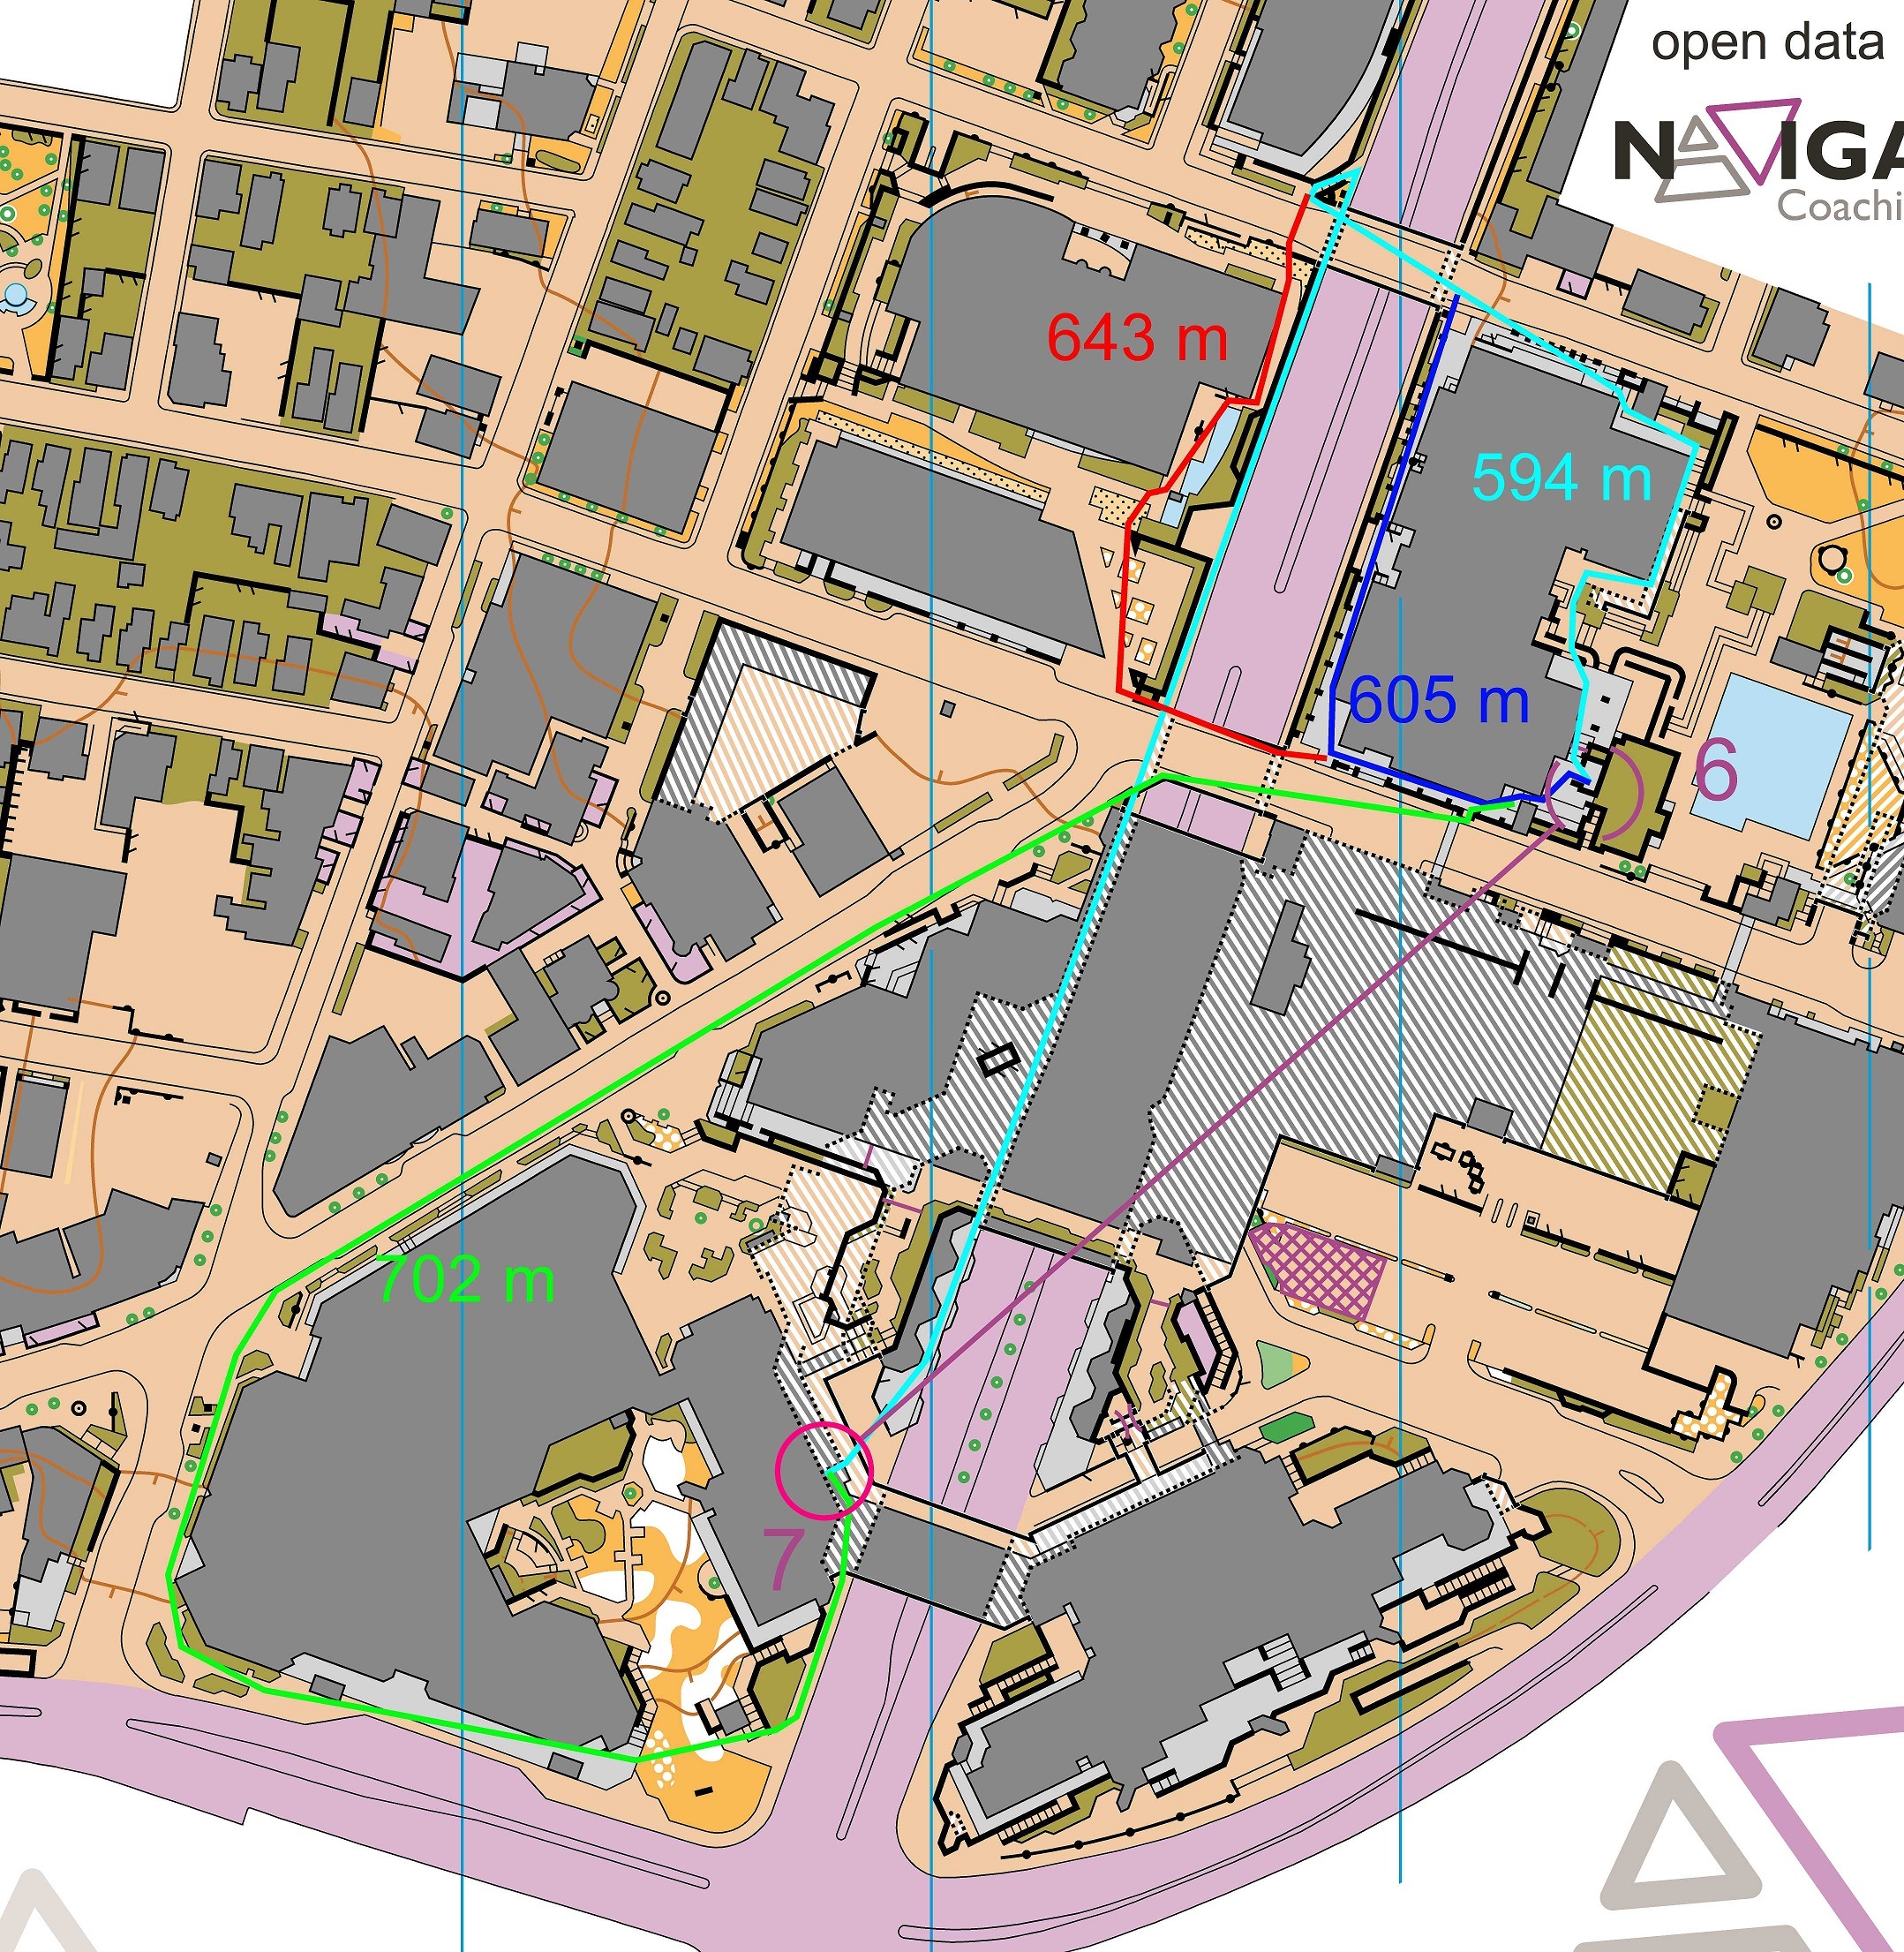
Leg 7 - With this leg the key is to figure out two things: how do you cross Boulevard de la Maisonneuve (the N-S street) and then how do you get to the lower Boulevard de la Maisonneuve level. Their are two ways to do this: a) crossing and descending the stairs to the north, and b) crossing and then looping around the office complex and approaching from the south. Taking the stairs to the north is shorter and faster. Looking at the lower level map once you get to the lower level can help you find the control more smoothly.
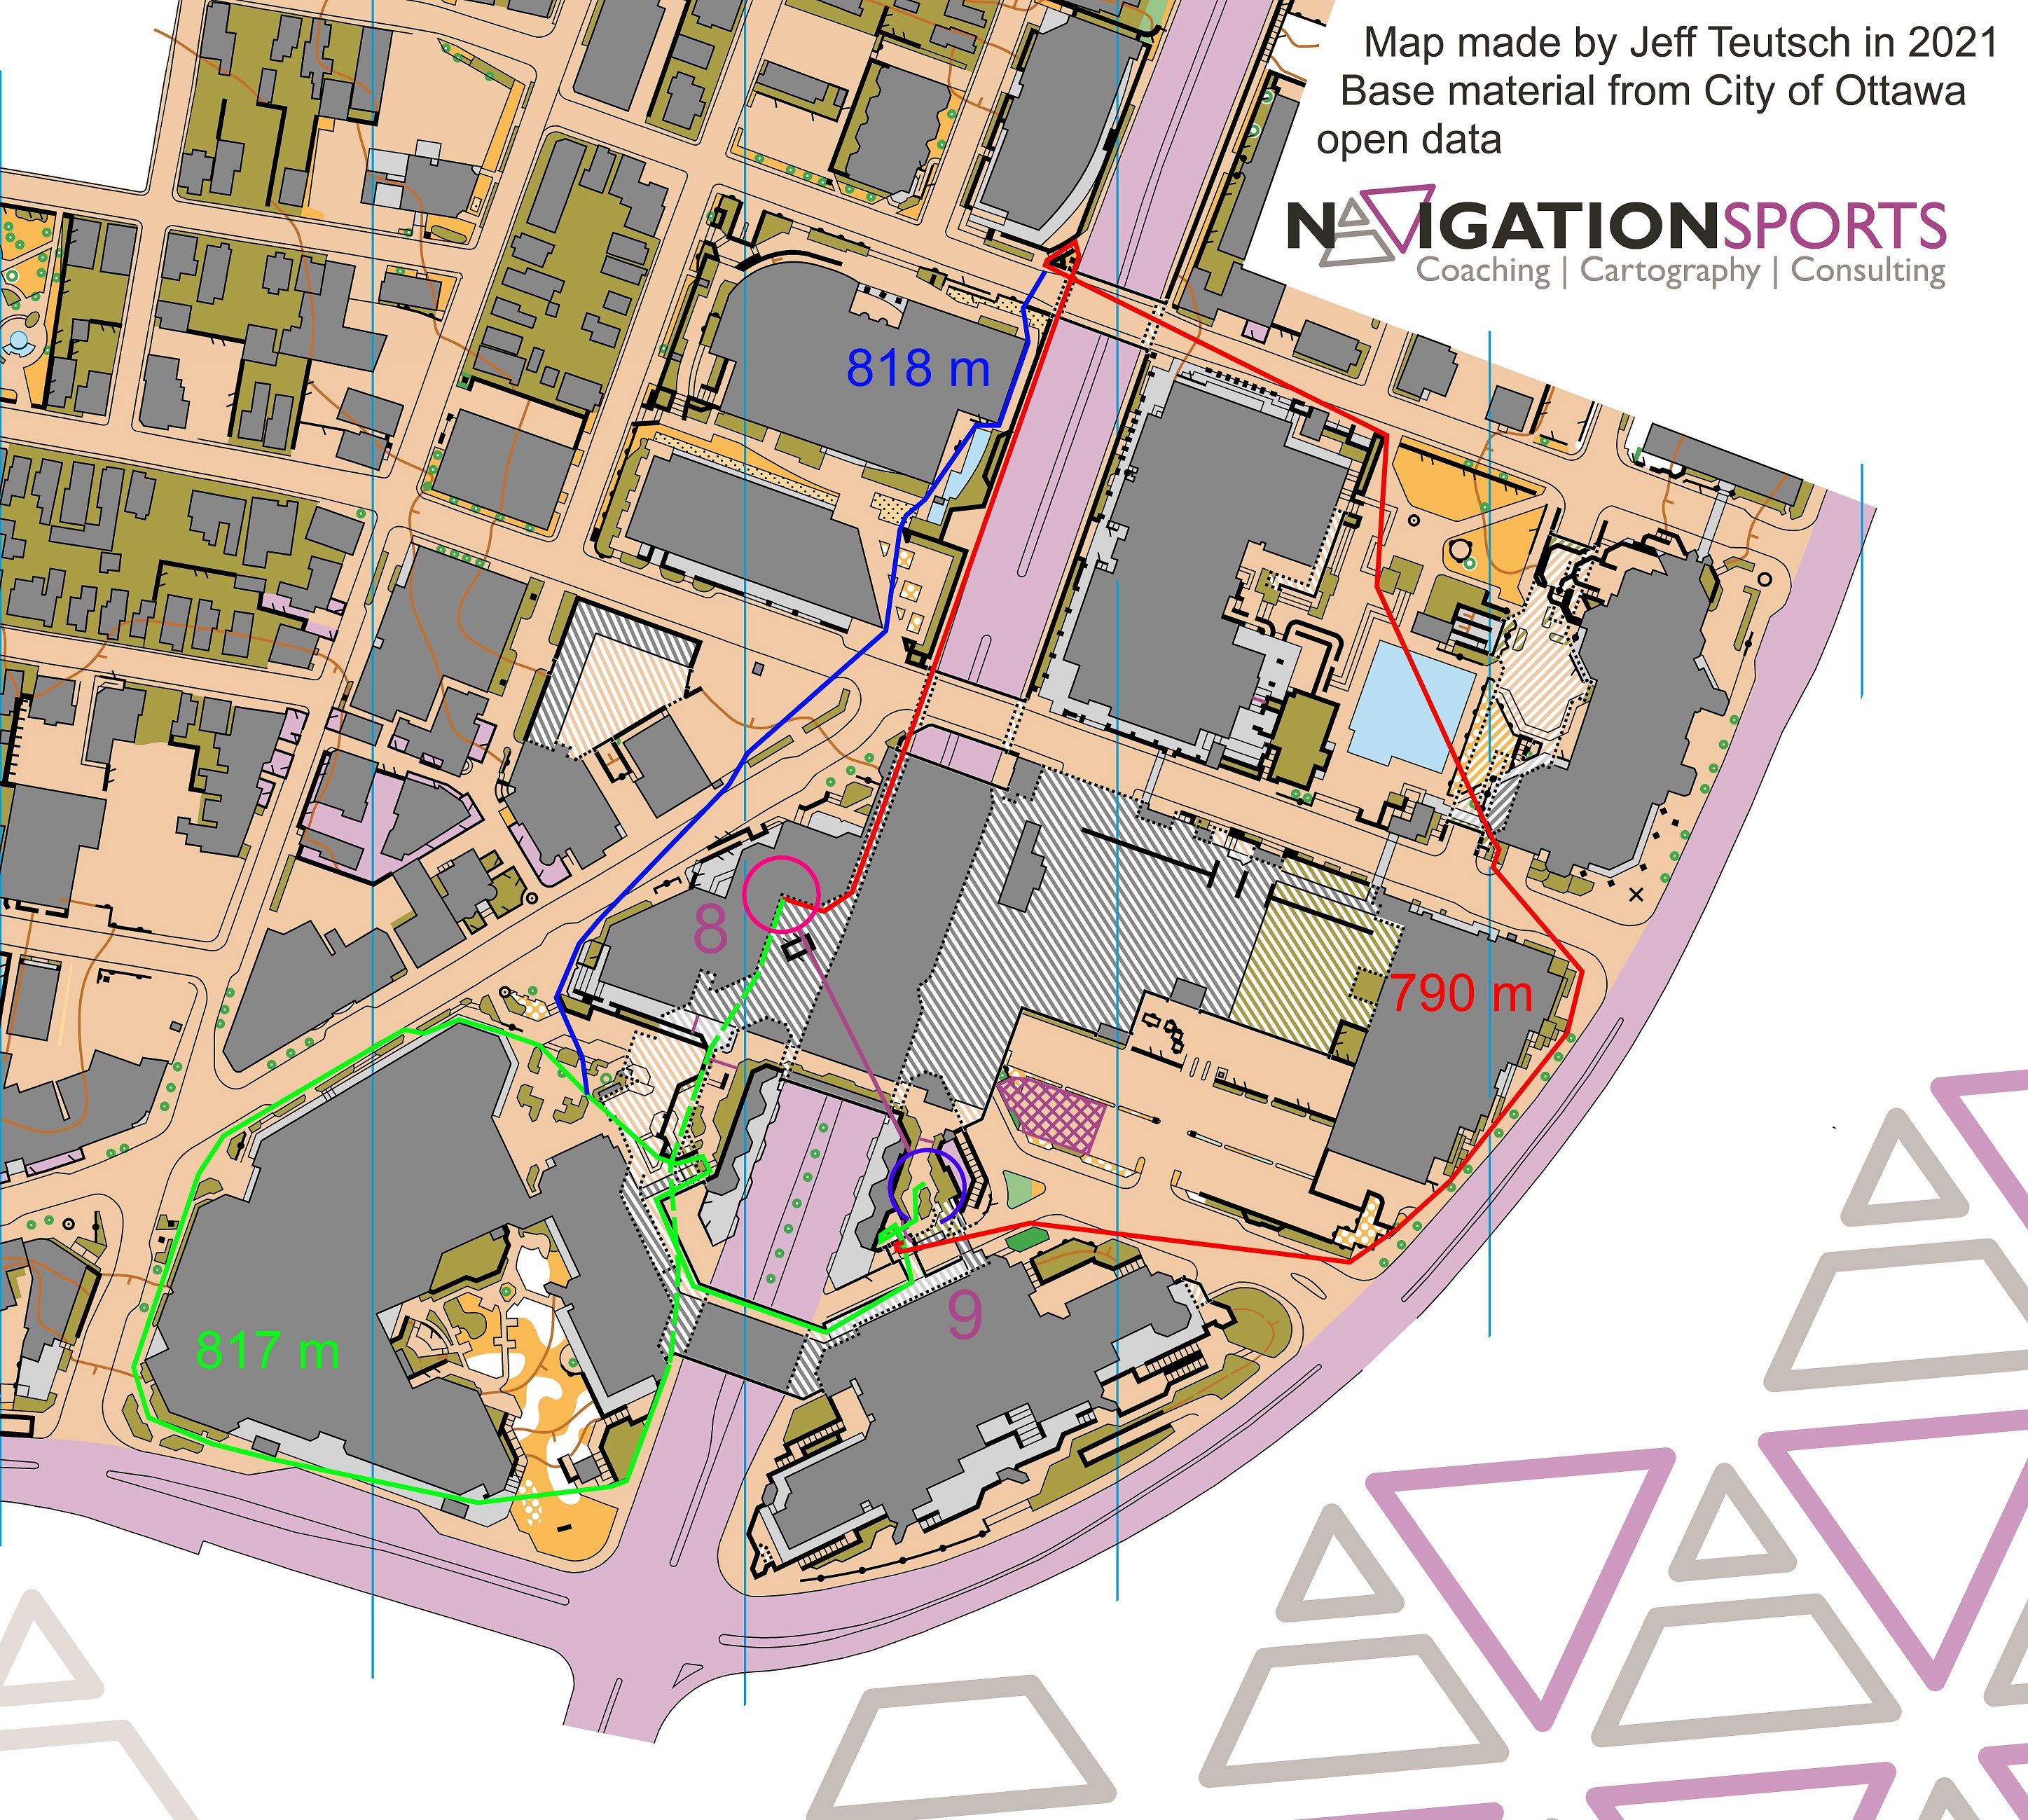
Leg 9 - With this leg there are three completely distinct options. The red route is a little shorter but requires finding the staircase south of control 9. In this case the best route is likely the route that you find first.
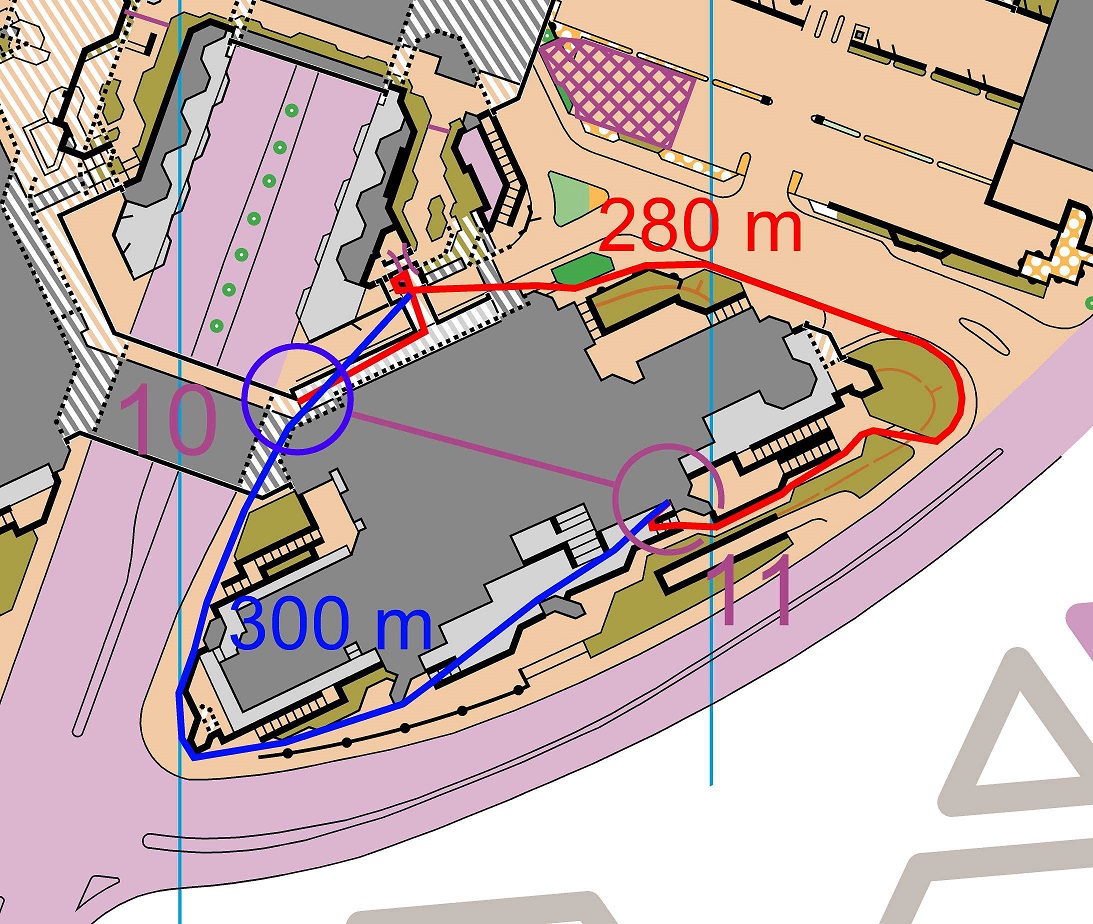
Leg 11 - This leg is a 'simple' left or right route choice with the left option being faster. Either way you have to find the stairs to descend to street level and then carefully navigate the stairs and canopies to find the control.
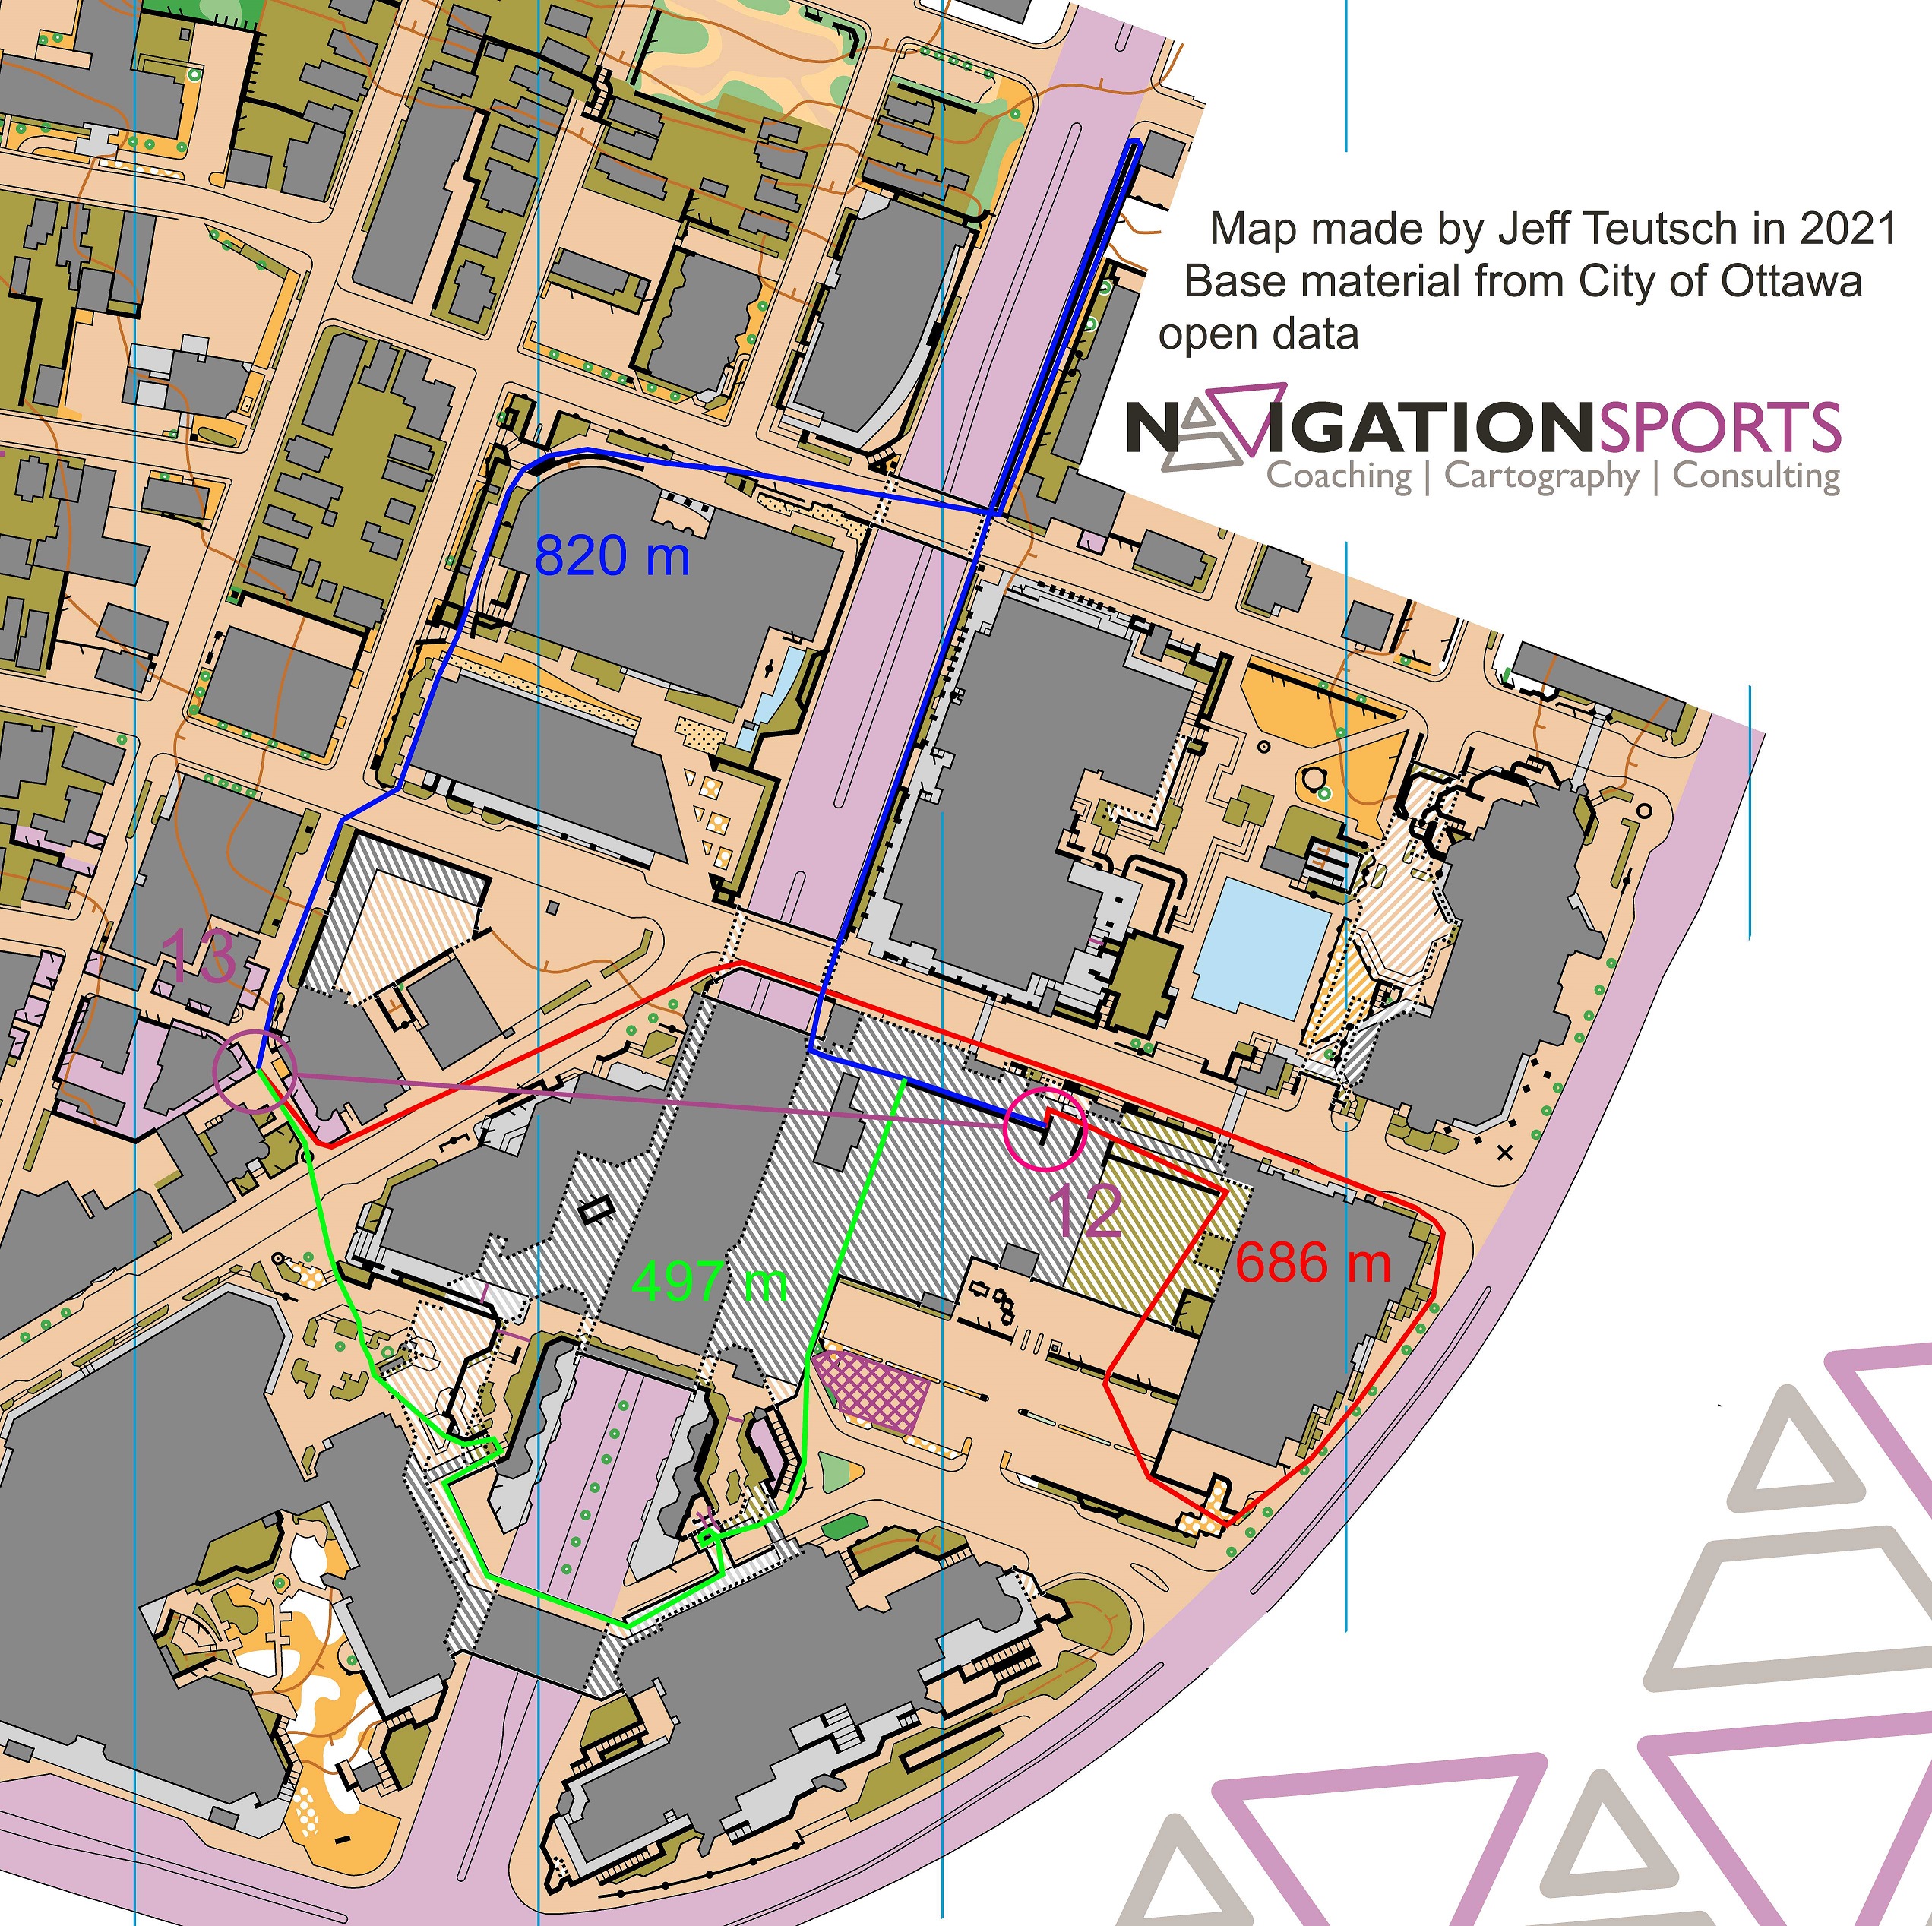
Leg 13 - This is another leg where there are 3 completely different routes and where have to figure out how to change levels and cross Boulevard de la Maisonneuve. In this case the green route is clearly the fastest. Note the lower level map has additional detail about the parking garage where control 12 is.
Part 2 - The Mapping Story
I’ve been driving to Gatineau Park ever since I first started driving 16 years ago and 90% of the time my route would take me along Boulevard Maisonneuve and through and under the Place du Portage government office complex in downtown Gatineau.
We commonly think of nature as chaotic and the humanity as bringing order to world. Driving through this portion of the city you can’t help but think the opposite is true.
One of the first things you see are staircases every which way – the kind that might inspire an Escher painting. Then you duck into a dimly lit cavern as it might be imagined by Henry Ford – pavement covered and with cars everywhere – before emerging into a concrete canyon with a river of cars at the bottom. Gatineau Park makes so much calming sense in comparison.
Nonetheless, I’ve long been intrigued by this urban multi-level maze brought about by the architects of the 1970s and 80s. If you had asked someone to design an area for sprint orienteering they could hardly have done a better job!
I first tried to map this area about 6 years ago using the minimal data I had available – largely screenshots from Google maps. This was, needless to say, a challenge which such a complex area. On top of that I was using the 2007 sprint specification. The old ISSOM had a basic way of mapping simple bridges and tunnels – say a bike path going over a road – but which was highly inadequate to map an underground parking garage with 5 entrances and details over top.
I gave up.
Then the IOF came out with the ISSprOM (International Specification for Sprint Orienteering Mapping) which included striped symbols to show ‘areas runnable on two levels’ in addition to the bridge and tunnel symbols which already existed. The City of Ottawa also had a better open data portal which allowed me to get a much better start on the map with pavement outlines, building outlines, trees, walls, and many other useful things.
Now the map seemed much more approachable. But still, mapping an area like this would involve really pushing the boundaries of multi-level mapping. I decided to start with a nearby area on the Ottawa side of the river which involved a variety of interesting tunnels – a tunnel under a tunnel, a large bridge with an underpass and a bus shelter on top, etc. Complicated but an order of magnitude simpler than Place du Portage.
I spent about 50-60 hours putting this Lebreton map together last November. It proved an opportunity to not only experiment with mapping tunnels and multi-level areas but also to explore my own branding as this was a side project that no one actually asked me to work on. It was a fun project and also a very educational one. At the end of it I posted the map along with photos to get the Facebook group Orienteering Mappers Int. That post generated a lot of comments and some great suggestions which I incorporated to greatly improve the map.
So after regretting getting obsessed and spending 50-60 work hours on an unpaid project what do I do next? Obviously start an even more complicated unpaid mapping project.
This time the area was way more complex and I could do far less sitting at my desk because half of it isn’t visible from aerial photos. But at least I could start with a lot of it from my desk over the winter (Google Street View really helps!). Countless hours when I should have been doing other work, or while bored on a Saturday morning went into prepping a lot of the map.
Then a few rounds of field work for much of the area covered much of the next leg of the mapping. Until awkward questions from security guards caused me to retreat. In the end a significant portion of the fieldwork ended up being done by smart phone video taken surreptitiously and then drawing the map from home. I don’t think that was a bad choice regardless. The precision drafting required for clean sprint mapping is far more easily done on a computer at a desk then with a tablet in the field.
But that’s not enough, creating a good map requires having good geo-referenced data of some kind to ensure everything is correctly positioned – at least relative to nearby features. For the underground areas this data didn’t exist and gps was useless. The answer? Line up features to features outside that you can see on the aerial photos and count the number of pillars, do some math and create a reference grid to line everything up! This is a technique I’ve used before but never to this degree!
On top of these challenges were the understandable limitations of the mapping specification. The new mapping specification is far better with multi-level areas than the old one but mapping multiple levels in a single two dimensional sheet of paper has inherent challenges. I knew right from the start that I’d use three maps – one combined using the striped symbols, one just showing the upper level, and one just the bottom level. Cutting those out to avoid disjoints was fun.
The map showing the striped symbols required a lot of careful thought, many many iterations, and some modifications to the standard symbols. The bridge symbol, for example, was made narrower and given a white outline so that long sections of bridges wouldn’t be confused with impassable walls. The square dotted edge of tunnel symbol wasn’t modified but was used in an unconventional way to show walls in the lower level. And the striped versions of the dark gray building colour, light gray canopy colour, and olive green, were used even though many mappers would argue they shouldn’t be.
The end result is confusing, but hopefully less confusing than alternative mapping solutions would be! I was excited to use the map for the first time on November 4th. I don’t think I’ve ever seen so many confused orienteers on one course. They tell me they still had fun though. I can’t tell if they were lying.